Solibri Score is available in Solibri v9.12.6 (and newer), and offers you an easy way to better understand the scope of the quality assurance that has been performed on the project. The score can only be calculated with Solibri Office. The score results, however, can be viewed also in Solibri Site and Anywhere. Score results are saved with the model.
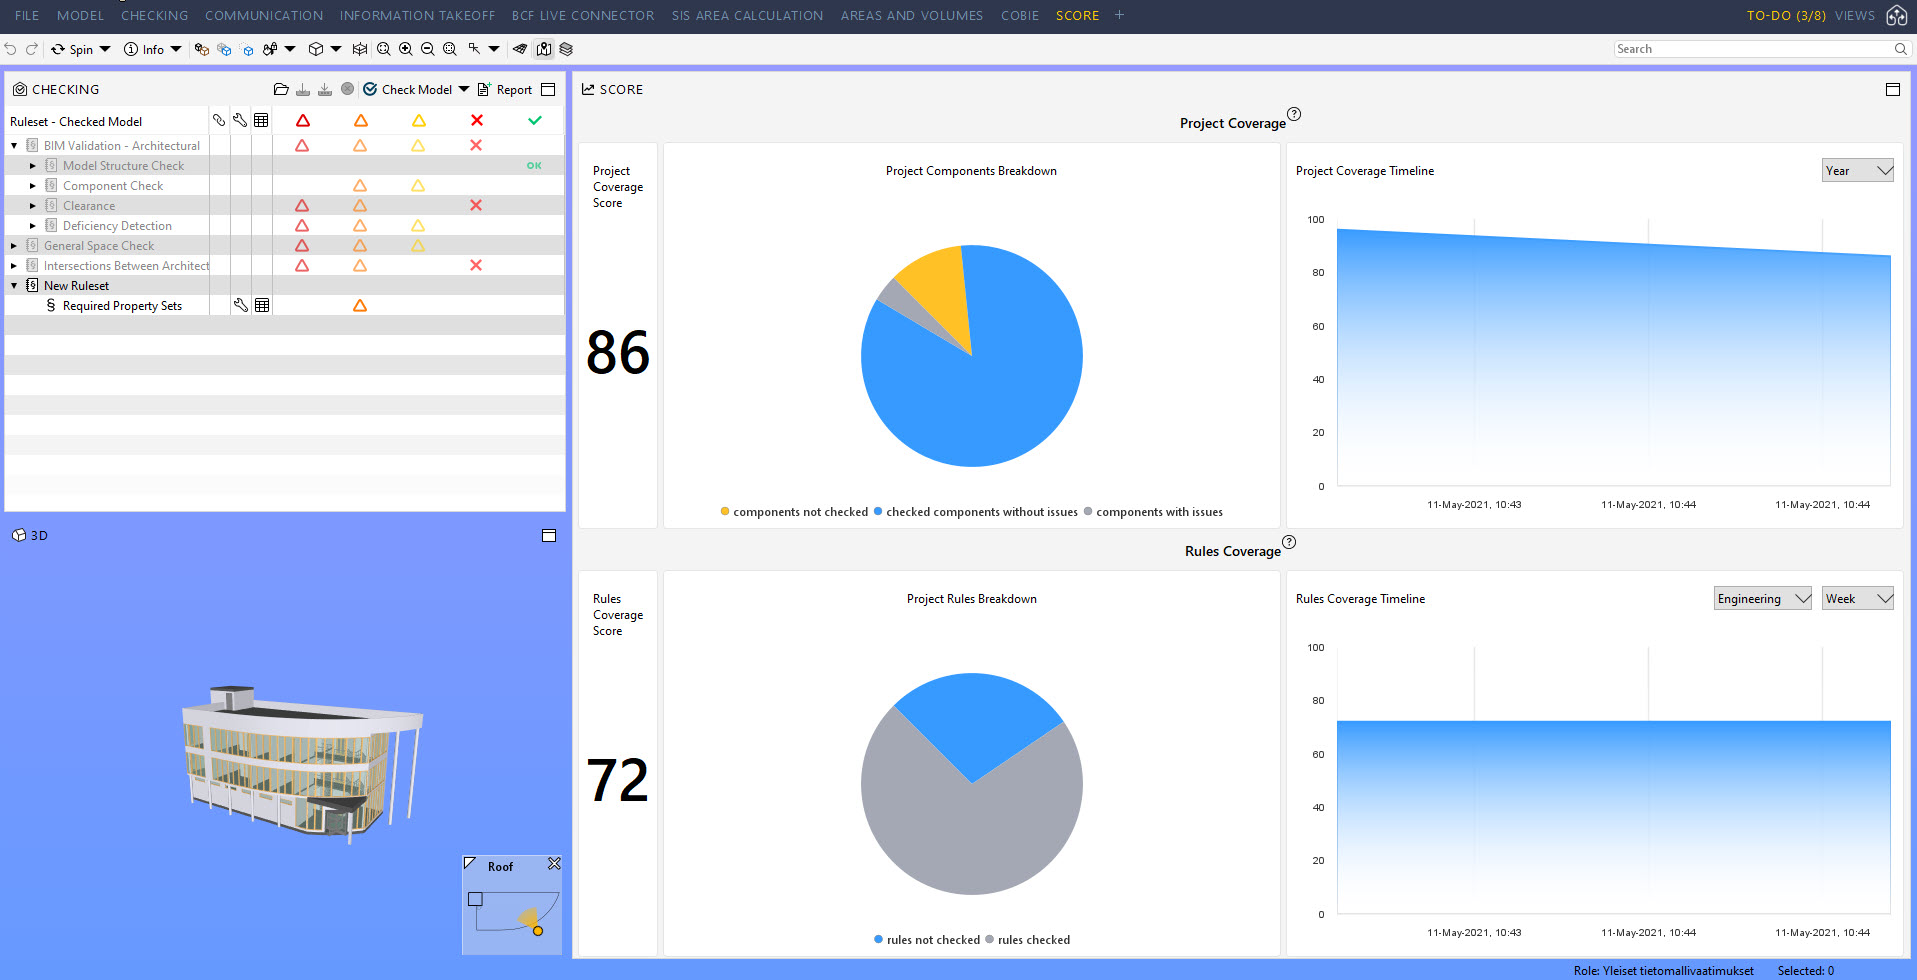
Solibri Score introduces a new view to assess the overall quality of the project based on two KPIs. Project Coverage shows how extensively the model has been checked, and Rules Coverage shows how extensively the rule templates have been utilized. Calculations are triggered every time you click Check Model in the Checking view.
Score has its own layout, but the Score view can be added to any layout from the Views list. The Score layout includes the Checking view, the 3D view and the Score view:

The Project Coverage score shows how many of the model’s components have issues out of the total checked components on a project. This will help you assess the coverage your checks have on the project, providing a simple, visual way to show the overall status. When updated regularly, you can see how the situation in your project develops over time.
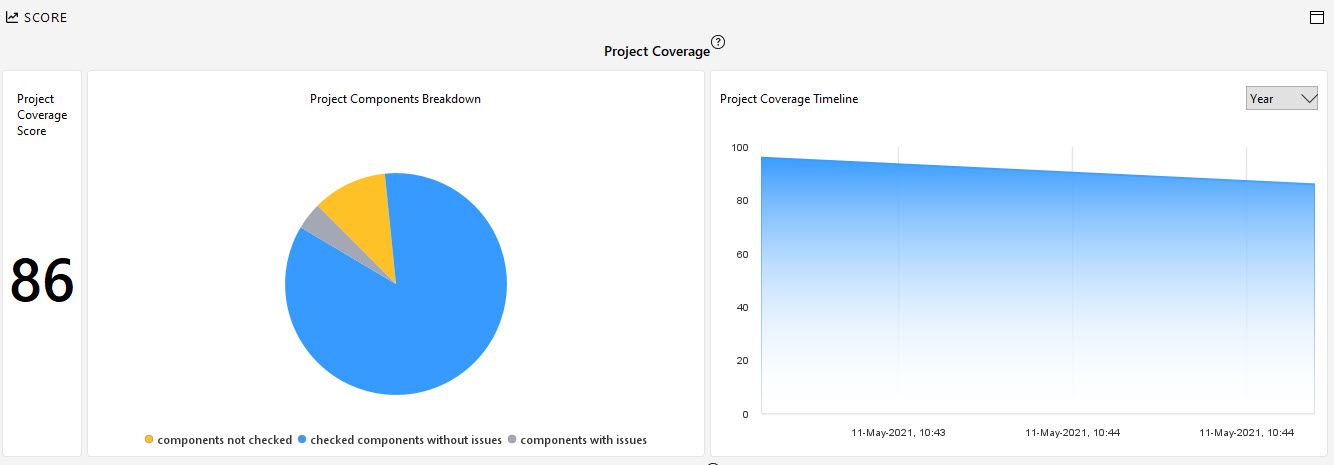
The Project Coverage section has three charts:
 |
Project Coverage Score: represents the overall quality of the project's components on a scale from 0 to 100. The higher the score the better.
-
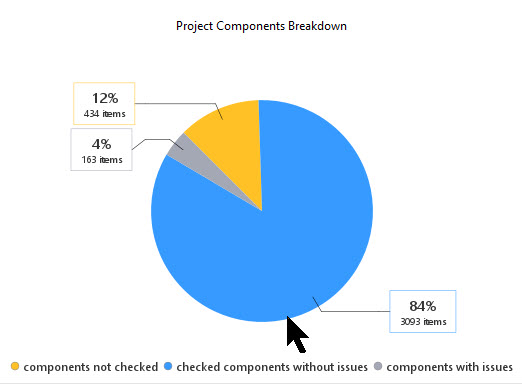
Project Components Breakdown, a pie chart that shows:
how many components have been checked with no issues
how many components have been checked with issues
how many components haven't been checked.
Tip
When you hover your mouse on the pie chart, you can see the details:

-
Project Coverage Timeline: shows the project coverage score over a period of time
By default, the timeline is set to Lifetime. You can select a different option from the drop-down menu.
The Rules Coverage score shows to what extent the rule templates have been used in checking, based on the selected industry. You can update the score regularly to follow the trend if you amend the usage of the predefined rules in your project.
For the Rules Coverage score to be calculated, you need to first select the industry relevant to your project from the drop down menu. Each industry has a specific set of rule templates relevant to it. The industry options are:
Architecture
Engineering
Consulting
Construction
Other AEC
Undefined
The Rules Coverage section has three charts:
 |
Rules Coverage Score: shows how many rules you are using out of all the relevant rules for your industry. The higher the score, the better.
-
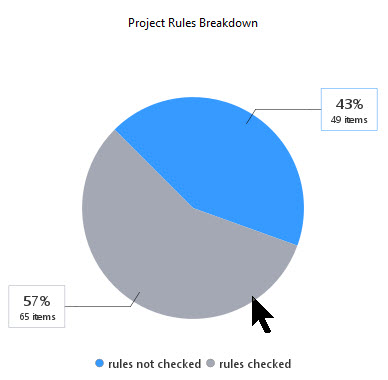
Project Rules Breakdown, a pie chart that shows:
how many rules have been checked
how many rules haven't been checked.
-
Rules Coverage Timeline: Rule coverage score for the whole project over a period of time.
